What the September 2026 JOLTS Report Says About 2027 Staffing Assumptions

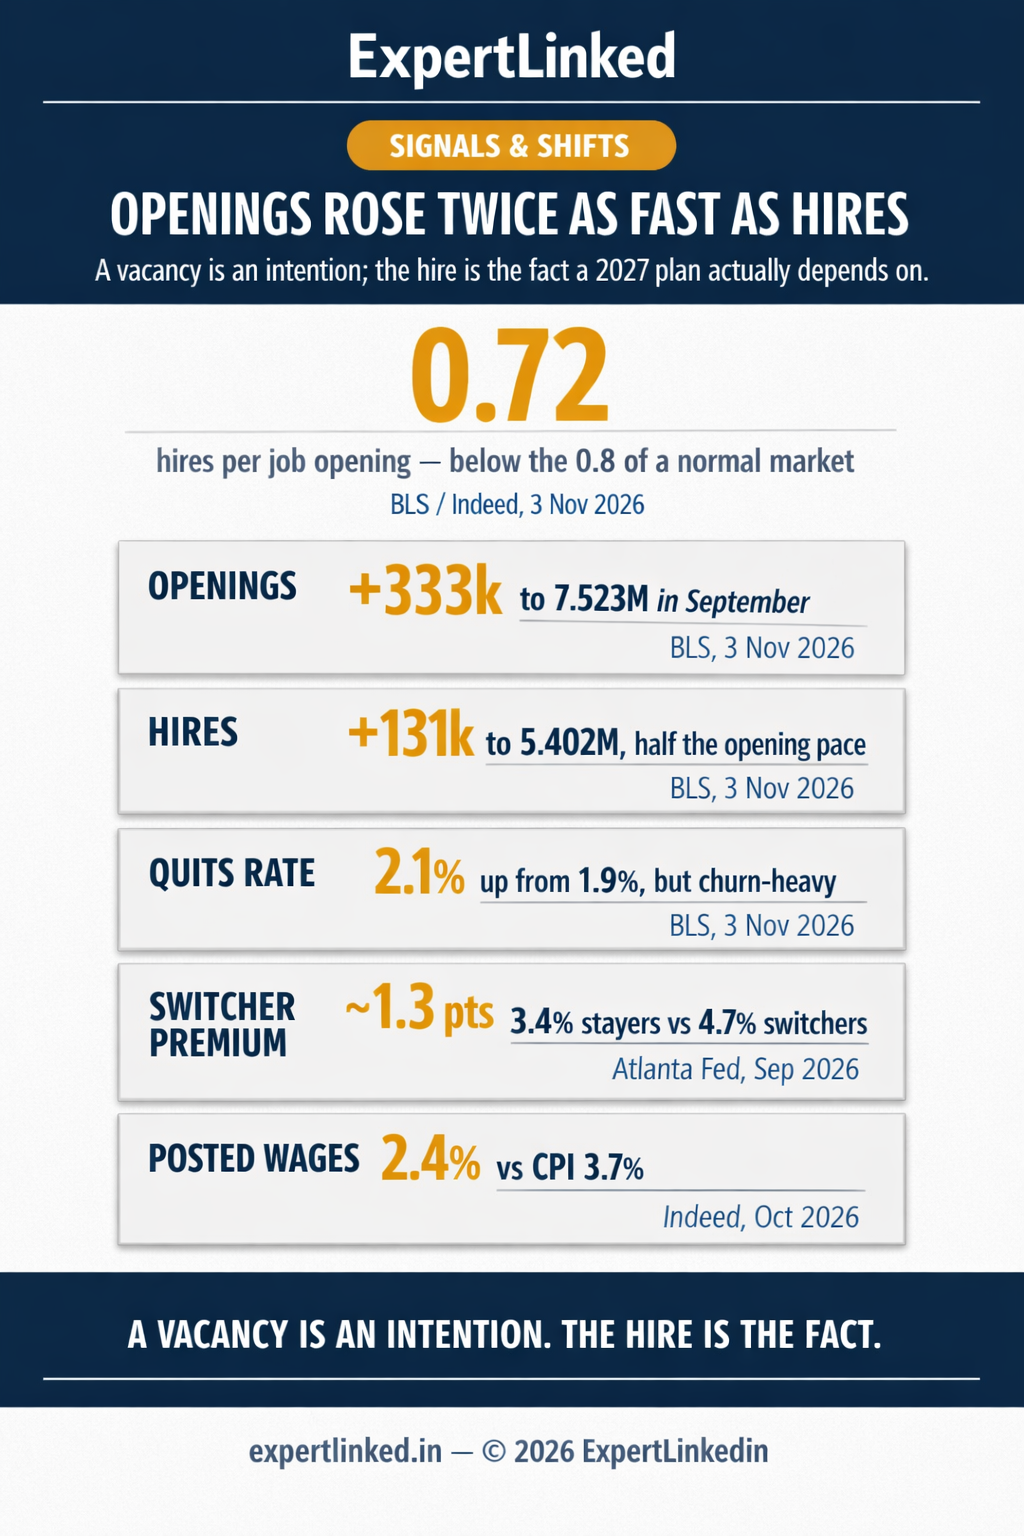
The September JOLTS report, released November 3, added 333,000 job openings. It added 131,000 hires. That is the whole story in two numbers: employers are posting roles more than twice as fast as they are filling them.
If your 2027 plan quietly assumes a colleague will be in the seat by a certain date, those two numbers are your risk register.

The release said ’little changed.’ The table said +333,000. #
Here is the first thing to notice, and almost nobody will. The Bureau of Labor Statistics described September job openings as “little changed at 7.5 million” (BLS JOLTS, September 2026). But the table underneath it shows the level rising from 7.190 million in August to 7.523 million in September — a +333,000 jump, and the highest reading in the entire September-2025-to-September-2026 window (BLS JOLTS Table 1). The adjective and the number disagree. Trust the number.
Hires rose too — but only to 5.402 million, up +131,000 (BLS JOLTS Table 2). Divide hires by openings and you get the vacancy yield: about 0.72 hires per opening. That ratio is not improving. It was 0.73 in August and 0.70 in July, and it sits well below the roughly 0.8 of a healthy 2019 market (Indeed Hiring Lab, August 2026 JOLTS). Employers are listing more than they are closing.
This is the mechanism behind the column’s recurring warning. I said on September 30 that openings are intent and an intention is not a hire. September tested it: intent rose 4.6% month over month, and conversion rose 2.5%. The gap widened.
The quits number overturns October — until you open the table #
Now the surprise, and it cuts against my own read from late October. Quits rose to 3.365 million, and the quits rate ticked up from 1.9% to 2.1% (BLS JOLTS Table 4). Over the year, nonfarm quits are up 375,000. On October 28 I called quits “pinned near a five-year low” and the switching market “narrowing, not opening.” The headline now says something moved.
So the honest upgrade is real: mobility is no longer frozen. It is selectively thawing. But “thawing” and “reopening” are different claims, and the composition is where they diverge.
Almost the entire quits increase came from a handful of high-churn, low-wage corners of the economy. Accommodation and food services added +197,000 quits — its quits rate jumped from 3.6% to 5.0%. Construction added +46,000 (1.8% to 2.4%). Trade, transportation, and utilities added +36,000. And the West region added +195,000, from a rate of 1.3% to 1.9%.
Meanwhile, the jobs most readers would actually switch into stayed pinned. Quits in professional and business services sat at 2.1%, information at 1.4%, financial activities at 1.1%, and manufacturing at 1.6%. None of those moved in any meaningful way.
There is a mechanical explanation, and it is not a story about worker confidence. Indeed’s seasonal-hiring data shows seasonal postings running about 10% above last year and 7% above 2019 — the best start in several years — with loading and stocking roles now 9% of seasonal postings, up from 3.5% in 2019 (Indeed Hiring Lab, October 15, 2026). Holiday staffing produces exactly this pattern of churn. Some of the September “mobility” is the calendar, not a change in the market.
The clincher is pay. If workers were leaving for better offers, the switcher premium would widen. It did not. The Atlanta Fed’s Wage Growth Tracker still shows job stayers at 3.4% and job switchers at 4.7% — a premium of roughly 1.3 percentage points, near its cycle low (Atlanta Fed Wage Growth Tracker, September 2026). Rising quits plus a flat premium is the signature of churn: people leaving roles, not winning raises to leave.
The 2027 test: posted is not filled #
Here is where this stops being a macro story and becomes your staffing plan. An employer can carry a vacancy and still fill it slowly. So the useful question for 2027 is not “how many roles are open?” It is “which of the roles my plan depends on are already filled?”
Look at where hiring actually fell in September. Hires dropped in manufacturing (-34,000), professional and business services (-30,000), financial activities (-12,000), and government (-24,000). They rose mainly in accommodation and food services (+158,000) and construction (+49,000) (BLS JOLTS Table 2). The openings rose in government (+98,000) and professional and business services (+106,000) — but the hires in those generalist categories did not follow.
Financing makes the conversion problem worse, for the employers least able to absorb it. The Federal Reserve’s October Senior Loan Officer Opinion Survey, released November 2, found that lending standards for large and middle-market firms were basically unchanged, but standards tightened for small firms, and demand for business loans weakened because firms are pulling back on investment in plant and equipment (Federal Reserve, October 2026 SLOOS). Translation: the employers most likely to leave a vacancy open are the ones facing the tightest terms.
There is a deeper reason a vacancy can sit for months, and it is not laziness. MIT Sloan Management Review’s research on “employee mobility barriers” describes why workers stay — and the same barriers make external hiring slow, because the people you need are the people their employer is working hardest to keep (MIT Sloan Management Review, August 18, 2026). The retention lever and the hiring lever are the same lever.
The demand is real — and narrower than the headline #
To be fair to the optimists: postings are genuinely improving. Indeed’s Job Postings Index hit 103.8, up 2.8% year over year — the first sustained positive reading in almost four years — and 68% of occupational sectors now post above year-ago levels, up from 49% in early September (Indeed Hiring Lab, October 2026 snapshot).
But two details deflate the headline. First, new postings — those seven days old or newer — are stuck at 99.2, drifting sideways. Overall postings are up partly on favorable base effects, not fresh demand. Second, the breadth is lopsided. On Indeed’s sector index, Engineering sits near 145, Healthcare near 131, and Production and Manufacturing near 124 — while Human Resources is near 99 and Software Development near 79. In the big tech hubs it is worse: Seattle at 67, San Francisco at 72.
And the money is not following. Posted wages grew 2.4%, against CPI of 3.7%; inflation-adjusted average weekly earnings fell 0.5% month over month, and take-home pay is down about 0.1% over the year (Indeed Hiring Lab, October 2026). AI-related postings are now 7.3% of all postings, past their 2022 peak — but that is a re-weighting of demand, not a rising tide for everyone.
That is the same substitution story I flagged on October 21: the question is never whether demand exists, but who gets the req. This month’s answer is engineers, clinicians, and skilled trades — not generalists. Indeed’s own survey of 120-plus economists expects slightly steadier hiring, but also deeper AI-driven downward pressure on the real wages of college-educated workers (Indeed Hiring Lab, Q3 2026 outlook).
What to watch — and one rule for your plan #
Three tests land in the next six days, and none of them is in this report. The Q3 Productivity and Costs release arrives November 5, October payrolls on November 6, and October CPI and Real Earnings on November 10 (BLS November 2026 schedule). The next mobility read — October JOLTS — does not land until December 1. Until then, treat a single month’s quits uptick as one data point, not a trend; remember that August quits were revised down by 22,000, which flattered September’s move.
So here is the decision rule, and it is the same one this column has used all quarter, sharpened for planning season.
Read your 2027 plan the way JOLTS reads a market — by conversion, not by postings. For every colleague your plan quietly assumes, do three things: name the seat, name the date they must be in it, and name the fallback if the seat is still empty when the work starts. And when you judge whether mobility is opening up, judge it by the composition of quits — by function and by sector — not by the headline rate.
The tone of this market keeps improving faster than the movement underneath it. The September report did not break that pattern; it confirmed it. A vacancy is an intention. The hire is the fact.
Building a 2027 plan that depends on people who aren’t in the seat yet? Tell me which role you’re waiting on — and I’ll help you pressure-test the start date.
Email me at jackson.rodriguez@tlnw.uk
References
-
U.S. Bureau of Labor Statistics (November 3, 2026). “Job Openings and Labor Turnover — September 2026.” https://www.bls.gov/news.release/jolts.nr0.htm (Accessed November 4, 2026)
-
U.S. Bureau of Labor Statistics (November 3, 2026). “JOLTS Table 1. Job openings levels and rates by industry and region, seasonally adjusted.” https://www.bls.gov/news.release/jolts.t01.htm (Accessed November 4, 2026)
-
U.S. Bureau of Labor Statistics (November 3, 2026). “JOLTS Table 2. Hires levels and rates by industry and region, seasonally adjusted.” https://www.bls.gov/news.release/jolts.t02.htm (Accessed November 4, 2026)
-
U.S. Bureau of Labor Statistics (November 3, 2026). “JOLTS Table 4. Quits levels and rates by industry and region, seasonally adjusted.” https://www.bls.gov/news.release/jolts.t04.htm (Accessed November 4, 2026)
-
U.S. Bureau of Labor Statistics (accessed November 4, 2026). “Schedule of Selected Releases for November 2026.” https://www.bls.gov/schedule/2026/11_sched.htm
-
Indeed Hiring Lab (October 22, 2026). “US Labor Market Snapshot — October 2026.” https://hiringlab.indeed.com/2026/10/22/us-labor-market-snapshot-october-2026/ (Accessed November 4, 2026)
-
Indeed Hiring Lab (October 15, 2026). “Seasonal Hiring Is Off to a Fast Start, With an Eye Toward 2027.” https://hiringlab.indeed.com/2026/10/15/seasonal-hiring-is-off-to-a-fast-start/ (Accessed November 4, 2026)
-
Indeed Hiring Lab (September 29, 2026). “August 2026 JOLTS Report: Little Change, Limited Dynamism.” https://hiringlab.indeed.com/2026/09/29/august-2026-jolts-report/ (Accessed November 4, 2026)
-
Indeed Hiring Lab (September 24, 2026). “Economists See Slightly Steadier Hiring Ahead, but Offer an AI Wage Warning for College Grads.” https://hiringlab.indeed.com/2026/09/24/q3-labor-market-outlook-survey/ (Accessed November 4, 2026)
-
Board of Governors of the Federal Reserve System (November 2, 2026). “The October 2026 Senior Loan Officer Opinion Survey on Bank Lending Practices.” https://www.federalreserve.gov/data/sloos/sloos-202610.htm (Accessed November 4, 2026)
-
Federal Reserve Bank of Atlanta (October 8, 2026 update). “Wage Growth Tracker.” https://www.atlantafed.org/chcs/wage-growth-tracker (Accessed November 4, 2026)
-
MIT Sloan Management Review (August 18, 2026). “What Gets Your Best Employees to Stay.” https://sloanreview.mit.edu/article/what-gets-your-best-employees-to-stay/ (Accessed November 4, 2026)
-
U.S. Bureau of Labor Statistics (October 2, 2026). “The Employment Situation — September 2026.” https://www.bls.gov/news.release/archives/empsit_10022026.htm (Accessed November 4, 2026)
-
U.S. Bureau of Labor Statistics (October 14, 2026). “Consumer Price Index — September 2026.” https://www.bls.gov/news.release/archives/cpi_10142026.htm (Accessed November 4, 2026)
-
U.S. Bureau of Labor Statistics (October 14, 2026). “Real Earnings — September 2026.” https://www.bls.gov/news.release/archives/realer_10142026.htm (Accessed November 4, 2026)
-
ExpertLinked (October 28, 2026). “What October’s Labor and Inflation Data Says Before the Oct. 28 Fed Decision - and Why Year-End Mobility Still Looks Selective.” https://expertlinked.in/posts/2026-10-28-what-octobers-labor-and-inflation-data-says-before-the-oct-28-fed-decision-and-why-year-end-mobility-still-looks-selective/
-
ExpertLinked (October 21, 2026). “What Early Q3 2026 Earnings Calls Say About AI Productivity - and Why Q4 Hiring Plans Still Look Narrow.” https://expertlinked.in/posts/2026-10-21-what-early-q3-2026-earnings-calls-say-about-ai-productivity-and-why-q4-hiring/
-
ExpertLinked (September 30, 2026). “What the August 2026 JOLTS Report Says About Q4 Hiring - Before the September PCE Data Lands.” https://expertlinked.in/posts/2026-09-30-what-the-august-2026-jolts-report-says-about-q4-hiring-before-the-september-pce-data-lands/
AI Content Notice
This article was created using artificial intelligence technology. Whenever possible, we include references and sources to support the information presented. Readers are encouraged to consult these sources for further information. While we strive for accuracy and provide valuable insights, readers should independently verify information and use their own judgment when making business decisions. The content may not reflect real-time market conditions or personal circumstances.
Related Articles
Infographic: What the September 2026 JOLTS Report Says About 2027 Staffing Assumptions
September JOLTS added 333,000 openings and only 131,000 hires. A vacancy is an intention, not a …
How to Build a 30-Day Q4 2026 External Option Without Looking Disengaged at Work
The real Q4 risk isn’t being seen looking for a job — it’s quietly reducing your …
Infographic: How to Build a 30-Day Q4 2026 External Option Without Looking Disengaged at Work
The real Q4 risk isn’t being seen looking for a job — it’s quietly reducing your …