What October's Labor and Inflation Data Says Before the Oct. 28 Fed Decision - and Why Year-End Mobility Still Looks Selective

The Federal Reserve is expected to hold interest rates steady today. That is genuinely good news, and it is almost entirely beside the point.
A hold is the absence of a new shock. It is not the arrival of a new opening. And when you read October’s labor and inflation data as one story, you can see exactly why the mood has improved while the market you would need to actually change jobs has not. The tone is better. The map is the same.
That gap is what this column has been tracking since September: the language of confidence keeps improving faster than the movement underneath it. This week is the pattern in a single suit. The Fed is expected to pause, the CPI headline is noisy, GDP looks solid, postings are up — and quits are still pinned near a five-year low. If you are planning a year-end move, the second group is the one that decides whether you can.

The relief is real. The relief is not leverage. #
Start with the policy logic, because it explains the mood. On September 16, the Fed raised its benchmark rate by a quarter point to 3.75%–4.00% — its first hike in more than three years — in a 12–0 vote, and justified it with a specific story about the economy: “Productivity growth is strong, and capital investment is robust. Job gains have kept pace with the workforce, and the unemployment rate has changed little” (Federal Reserve, September 16, 2026). The projections that came with that meeting had 16 of 18 officials expecting at least one more hike before year-end.
Then September printed 29,000 jobs. The odds of a hike this week collapsed, and markets now expect the Fed to pause on Oct. 28 and leave the December hike as the open question (FOMC calendar, 2026). That is the entire reason the late-October mood can improve on policy expectation alone: the most immediate risk got postponed, not removed.
So the same release that made the news cycle feel calmer is a sentence about December. It is not a signal about your mobility. The regime is still pause within tightening — not easing. Read the relief as relief, and do not let it do the work of evidence.
What October actually printed — and why inflation is context, not leverage #
The two releases this piece is anchored on landed two weeks apart, and they tell a stranger story than the headlines did.
The September jobs report (Oct. 2) added just 29,000 jobs, with the unemployment rate at 4.2%. July and August were revised down by a combined 60,000, leaving the three-month average at 51,000 — a labor market that is holding, not expanding. Average hourly earnings rose 3.0% over the year, the slowest since May 2021 (BLS, October 2, 2026). I called this the stock-versus-flow problem on October 7: the stock of employment looks stable, and the flow of people into new jobs is stuck.
The September CPI (Oct. 14) then accelerated to 3.7% year over year, up from 3.4% — but almost all of that was energy, which rose 20.4% over the year, with gasoline up 34.2%. Core inflation, which strips out food and energy, stayed contained at 2.6% (BLS, October 14, 2026).
Put the wage and price numbers together and you get the uncomfortable part. Real average hourly earnings fell 0.7% over the year (BLS Real Earnings, October 14, 2026), and the median full-time worker — the typical worker, not the average — earned $1,232 a week in the third quarter, up just 1.5% against CPI’s 3.5% over the same period (BLS, October 21, 2026). Real median weekly pay fell roughly two points.
That is the split I flagged on CPI day two weeks ago: the gauge moves, the drawer does not. A hot headline does not give you more bargaining power, and a cool core does not either. Inflation is context. It is not leverage.
The only numbers that answer the mobility question #
If you want to know whether the year-end switching market widened, ignore the Fed statement, the CPI print, and the stock ticker. Watch the four numbers that describe movement, not mood.
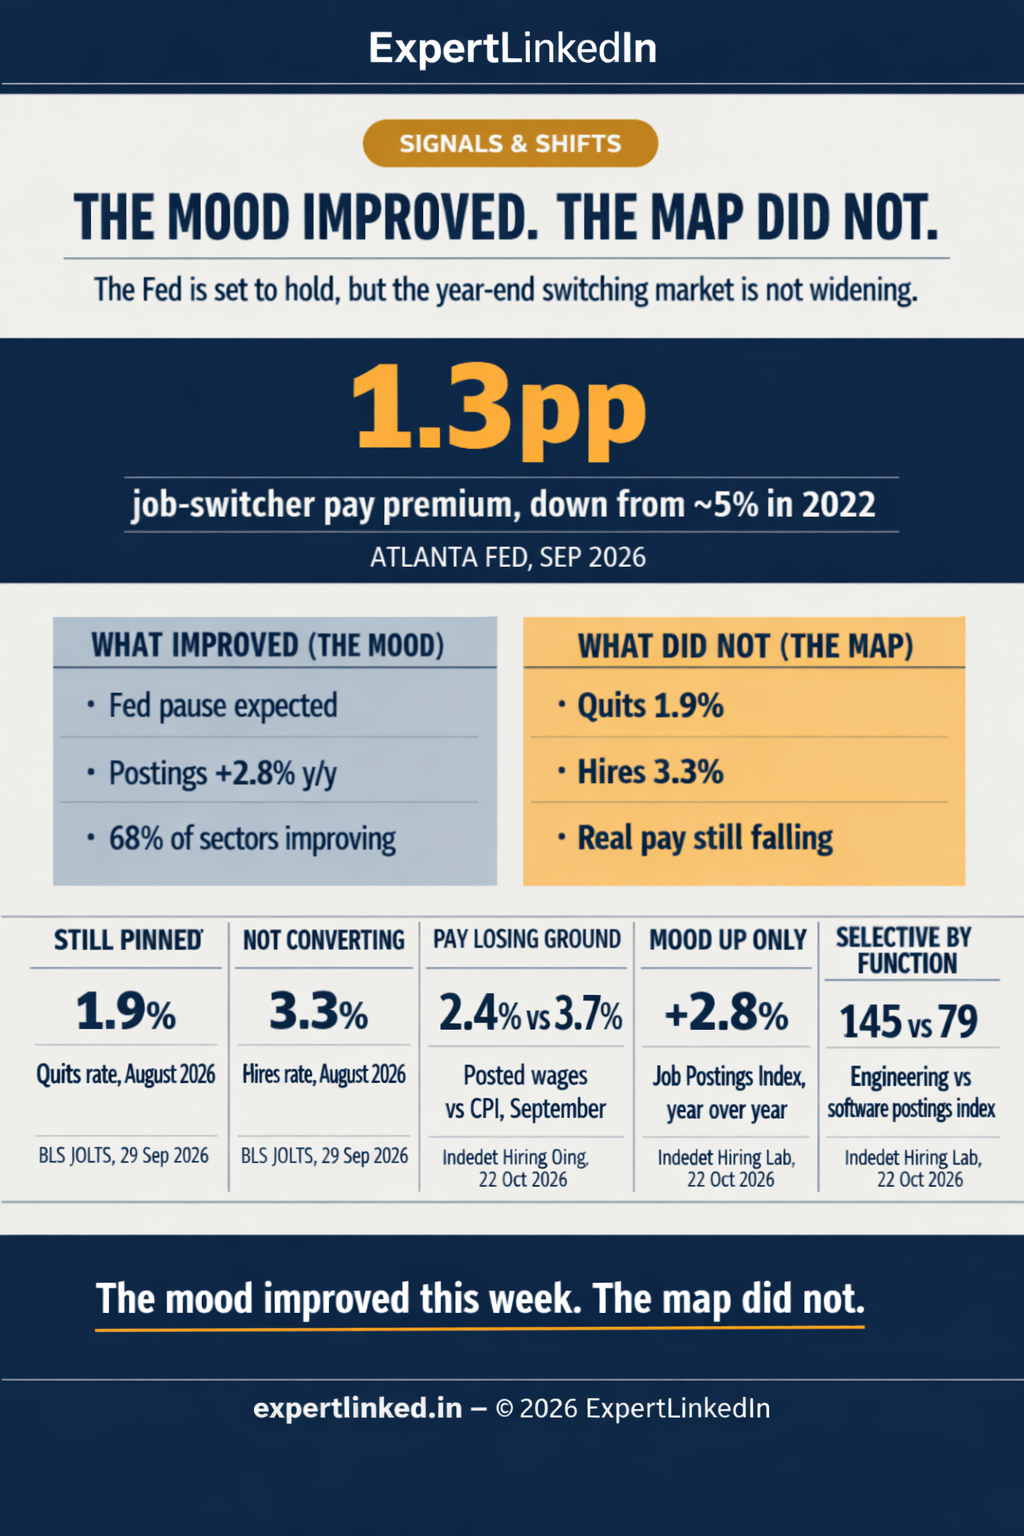
The August JOLTS report — the last one we have, because the next print does not land until Nov. 3 — showed hires at 3.3% of employment, quits at 1.9%, and a vacancy yield (hires per opening) of 0.71, below the roughly 0.8 of a normal 2019 market (BLS JOLTS). Quits at 1.9% sits at or near the lowest of the post-2021 period. I made this point on September 30: openings are intent, and an intention is not a hire.
The sentiment data says the same thing from the other side. Gallup found that only 28% of U.S. employees say now is a good time to find a quality job, even as 51% are actively looking or watching for opportunities — and that, for the first time in its tracking, more workers are struggling (49%) than thriving (46%) (Gallup, March 23, 2026). Half the workforce is watching the door precisely because it cannot walk through it.
Note what is missing from October: there is no fresh mobility datapoint. With no new JOLTS until Nov. 3, the entire month’s optimism is being argued from postings, inflation, and policy tone — the three things that change fastest and matter least to whether you can actually move. That gap is the story.
The surprise: the switching market is narrowing, not opening #
Here is the number almost nobody is quoting this week, and it settles the question in the title.
The Atlanta Fed’s Wage Growth Tracker for September put job stayers at 3.4% and job switchers at 4.7% — a switcher premium of roughly 1.3 percentage points (Atlanta Fed Wage Growth Tracker, September 2026). Two years ago, that premium was above 5%. Moving still pays — which is why “selective” is the honest word rather than “closed.” But the reward for moving has compressed toward its narrowest level of the cycle, even as the risk of a misfire has risen. The outside option is real. It is just smaller.
Now put the Indeed Hiring Lab’s October snapshot beside it. Postings are genuinely improving: the Job Postings Index hit 103.8, up 2.8% year over year — the first sustained positive reading in almost four years — and 68% of occupational sectors are now posting above year-ago levels (Indeed Hiring Lab, October 22, 2026).
But posted wages are growing 2.4%, against CPI of 3.7%. Advertised pay is losing ground to prices at the exact moment demand looks better. And the sector split is brutally uneven: Engineering ~145 and Healthcare ~131 on the strong side; Software Development ~79 and Human Resources ~99 on the weak side. In the big tech hubs, the postings index sits at 67 in Seattle and 72 in San Francisco.
That is not a reopening. That is substitution. Employers are rebuilding roles — AI-related postings are now 7.3% of all postings — at lower advertised wages and different task mixes. As I argued on October 21, the right question is not whether productivity is rising. It is who gets the req. Right now, the answer is: engineers, clinicians, skilled trades, and AI-adjacent operators — and not generalists.
What to watch next — and one decision rule #
Three tests land in the next six days, and none of them is the Fed’s press conference.
The Q3 GDP advance estimate (Oct. 29) will almost certainly look strong — growth was revised up to 2.5% and 2.2% in the first half, and AI-investment-driven equipment spending has been running hot (BEA). But a capital-led expansion is exactly the kind that can add growth while adding almost no payrolls. Strong GDP is not a mobility signal.
The Q3 Employment Cost Index (Oct. 30) is the pay-relevant number — the employer’s own cost of labor, which shapes next year’s salary bands. If it stays near its recent 3.3%–3.4% trend (BLS ECI), the pay story is unchanged no matter what the Fed says.
And then the honest one: the next JOLTS report on Nov. 3. Until quits and hires move, nothing about the switching market has actually widened.
So here is the decision rule, and it is the same one I have used all quarter. Judge your Q4 mobility by four numbers — quits, hires, the vacancy yield, and the job-switcher premium — not by the Fed statement, the CPI print, or a rally on a weak payroll number. If those four have not moved, a hold did not open a door. It just stopped closing one for a few more weeks.
The mood improved this week. The map did not. Plan like the map is what matters — because it is.
Reading October’s data against your own year-end plans? Tell me which number you’re actually using to decide — the Fed, the CPI, or the quits rate — and I’ll tell you what it’s really measuring.
Email me at jackson.rodriguez@tlnw.uk
References
-
Board of Governors of the Federal Reserve System (September 16, 2026). “FOMC Statement.” https://www.federalreserve.gov/newsevents/pressreleases/monetary20260916a.htm (Accessed October 28, 2026)
-
Board of Governors of the Federal Reserve System (accessed October 28, 2026). “2026 FOMC Meeting Calendar and Minutes.” https://www.federalreserve.gov/monetarypolicy/fomccalendars.htm
-
U.S. Bureau of Labor Statistics (October 2, 2026). “The Employment Situation — September 2026.” https://www.bls.gov/news.release/archives/empsit_10022026.htm (Accessed October 28, 2026)
-
U.S. Bureau of Labor Statistics (October 14, 2026). “Consumer Price Index — September 2026.” https://www.bls.gov/news.release/archives/cpi_10142026.htm (Accessed October 28, 2026)
-
U.S. Bureau of Labor Statistics (October 14, 2026). “Real Earnings — September 2026.” https://www.bls.gov/news.release/archives/realer_10142026.htm (Accessed October 28, 2026)
-
U.S. Bureau of Labor Statistics (October 21, 2026). “Usual Weekly Earnings of Wage and Salary Workers — Third Quarter 2026.” https://www.bls.gov/news.release/archives/wkyeng_10212026.htm (Accessed October 28, 2026)
-
U.S. Bureau of Labor Statistics (September 29, 2026). “Job Openings and Labor Turnover Survey — August 2026.” https://www.bls.gov/news.release/jolts.nr0.htm (Accessed October 28, 2026)
-
U.S. Bureau of Labor Statistics (July 31, 2026; Q3 release scheduled October 30, 2026). “Employment Cost Index.” https://www.bls.gov/news.release/eci.nr0.htm (Accessed October 28, 2026)
-
Indeed Hiring Lab (October 22, 2026). “US Labor Market Snapshot — October 2026.” https://hiringlab.indeed.com/2026/10/22/us-labor-market-snapshot-october-2026/ (Accessed October 28, 2026)
-
Indeed Hiring Lab (September 24, 2026). “US Labor Market Snapshot — September 2026.” https://hiringlab.indeed.com/2026/09/24/us-labor-market-snapshot-september-2026/ (Accessed October 28, 2026)
-
Indeed Hiring Lab (October 2, 2026). “September 2026 Jobs Report: Steadiness Without a Spark.” https://hiringlab.indeed.com/2026/10/02/september-2026-jobs-report-steadiness-without-a-spark/ (Accessed October 28, 2026)
-
Indeed Hiring Lab (October 15, 2026). “Seasonal Hiring Is Off to a Fast Start.” https://hiringlab.indeed.com/2026/10/15/seasonal-hiring-is-off-to-a-fast-start/ (Accessed October 28, 2026)
-
Federal Reserve Bank of Atlanta (October 2026 update). “Wage Growth Tracker.” https://www.atlantafed.org/chcs/wage-growth-tracker (Accessed October 28, 2026)
-
Gallup (March 23, 2026). “U.S. Worker Thriving Declines as Job Market Pessimism Grows.” https://www.gallup.com/workplace/703280/worker-thriving-declines-job-market-pessimism-grows.aspx (Accessed October 28, 2026)
-
U.S. Bureau of Economic Analysis (scheduled October 29, 2026). “Gross Domestic Product, Third Quarter 2026 (Advance Estimate).” https://www.bea.gov/data/gdp/gross-domestic-product (Accessed October 28, 2026)
-
ExpertLinked (October 21, 2026). “What Early Q3 2026 Earnings Calls Say About AI Productivity - and Why Q4 Hiring Plans Still Look Narrow.” https://expertlinked.in/posts/2026-10-21-what-early-q3-2026-earnings-calls-say-about-ai-productivity-and-why-q4-hiring/
-
ExpertLinked (October 14, 2026). “What the September 2026 CPI Report Could Change About Q4 Pay Talks - and What It Probably Won’t.” https://expertlinked.in/posts/2026-10-14-what-the-september-2026-cpi-report-could-change-about-q4-pay-talks-and-what-it/
-
ExpertLinked (October 7, 2026). “What the September 2026 Jobs Report Says About Q4 Hiring - Before the Fed Minutes Land.” https://expertlinked.in/posts/2026-10-07-what-the-september-2026-jobs-report-says-about-q4-hiring-before-the-fed-minutes-land/
-
ExpertLinked (September 30, 2026). “What the August 2026 JOLTS Report Says About Q4 Hiring - Before the September PCE Data Lands.” https://expertlinked.in/posts/2026-09-30-what-the-august-2026-jolts-report-says-about-q4-hiring-before-the-september-pce-data-lands/
AI Content Notice
This article was created using artificial intelligence technology. Whenever possible, we include references and sources to support the information presented. Readers are encouraged to consult these sources for further information. While we strive for accuracy and provide valuable insights, readers should independently verify information and use their own judgment when making business decisions. The content may not reflect real-time market conditions or personal circumstances.
Related Articles
Infographic: What October's Labor and Inflation Data Says Before the Oct. 28 Fed Decision - and Why Year-End Mobility Still Looks Selective
The Fed is expected to hold rates today — and the mood already feels better. But the numbers that …
Infographic: What Early Q3 2026 Earnings Calls Say About AI Productivity - and Why Q4 Hiring Plans Still Look Narrow
Early Q3 earnings calls are full of AI optimism — but it is arriving in the margin line, not the …
What Early Q3 2026 Earnings Calls Say About AI Productivity - and Why Q4 Hiring Plans Still Look Narrow
Early Q3 earnings calls are full of AI optimism — but it is arriving in the margin line, not the …