What the June Jobs Report Actually Said About the Hires Rate — and Whether the Stillness Broke

Fifty-seven thousand is not the number that matters most in the June jobs report.
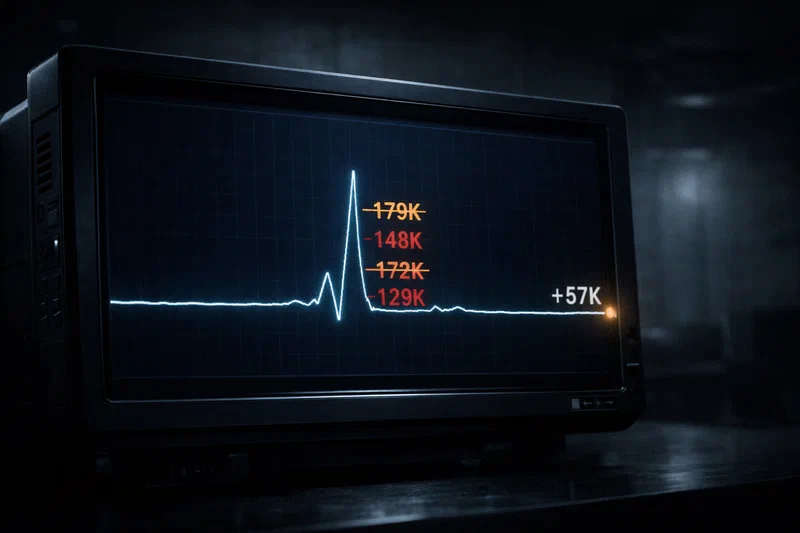
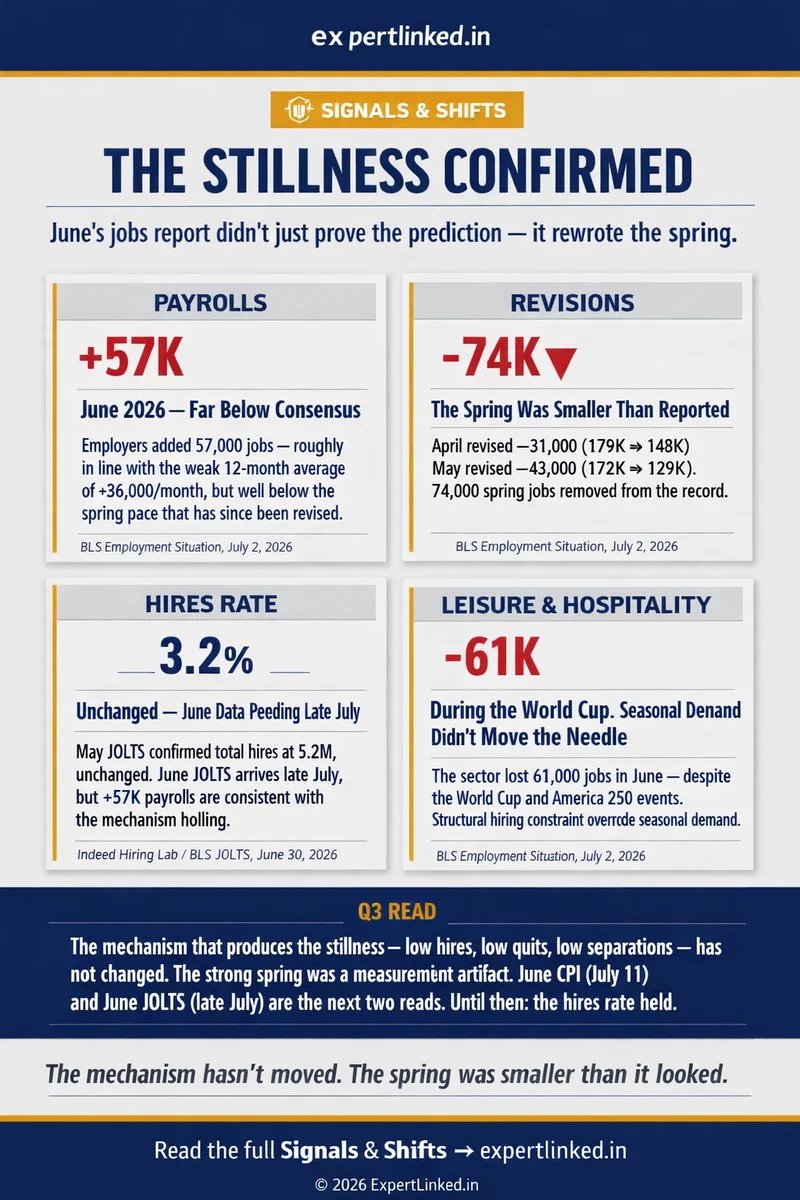
The numbers that matter most are 31,000 and 43,000 — the amounts by which April and May were each revised downward when the Bureau of Labor Statistics released the June employment situation on July 2 (U.S. Bureau of Labor Statistics, July 2, 2026). Combined, that is 74,000 jobs removed from the spring. Jobs that appeared in the data in May and June. Jobs that shaped the narrative about whether the labor market was building momentum. Jobs that, as of last Thursday morning, no longer exist in the official record.
The 57,000 is disappointing against consensus. The 74,000 in revisions tells you something structural.
The spring was revised away #
The July 1 Signals & Shifts made a specific prediction: watch the hires rate, not the headline payroll number. The payroll number is the output; the hires rate is the mechanism. At the time, the data showed the labor market averaging 114,000 new jobs per month over the first five months of 2026 — more than triple the 2025 pace. That looked, cautiously, like an acceleration.
It wasn’t. April is now +148,000. May is now +129,000. The twelve-month average through June 2026 is approximately 36,000 per month — and June’s 57,000, which the BLS describes as “roughly in line” with that average, is not evidence of a weak outlier (BLS, July 2, 2026). It is evidence that June is where the labor market actually is. The spring that looked like an acceleration was a measurement artifact that has now been corrected.
Anyone building a Q3 argument on the spring data — whether that argument was optimistic or cautious — should update it. The foundation is smaller.
The hires rate: what the data does and doesn’t say #
The specific June hires rate is not in the BLS employment situation release. It will not be known until the June JOLTS report, due in late July. The hires rate — the percentage of total employment that represents new hires in a given month — comes from a separate BLS survey.
What the May JOLTS (released June 30) confirmed is that total hires in May held at 5.2 million, unchanged from April. With approximately 160 million employed workers, that implies a hires rate of roughly 3.2% — the same reading that has prevailed since late 2024 and that the July 1 article named as the marker of the stillness period (Indeed Hiring Lab, June 30, 2026). The quits rate in May was also unchanged, at 1.9% — below 2% for nearly a year straight.
June’s 57,000 payrolls provide circumstantial evidence that the hires mechanism did not meaningfully shift. The mechanism generates the output. If employers had opened the front door at a materially higher rate in June, you would expect a stronger payroll number first — before the JOLTS survey would capture it. You’re not seeing that. The June JOLTS confirmation will arrive in late July, but the payroll data is already consistent with the prediction: the hires rate held.
Leisure and hospitality during the World Cup #
The sector breakdown deserves more attention than the headline is getting.
Leisure and hospitality shed 61,000 jobs in June — the sector’s worst month in the 2026 data (BLS, July 2, 2026). June was not an ordinary month for that sector. It included World Cup matches hosted in multiple U.S. cities and the formal beginning of America’s 250th anniversary events. Those are events that typically generate significant short-cycle hiring demand: hospitality, event staffing, security, food service. The sector reversed May’s surprisingly strong showing entirely.
The BLS’s framing — “reflects weaker than usual seasonal hiring” — is accurate but understates the significance. This was not just an absence of seasonal uplift. It was a decline during a period when every structural reason to hire was present. Indeed Hiring Lab’s Laura Ullrich observed in her July 2 analysis that hiring is currently “at levels near where we were 11 years ago, when the labor force was nearly 13 million people fewer than it is today” (Indeed Hiring Lab, July 2, 2026). The World Cup didn’t override that structural constraint. That is not a small finding.
The wage number: read it with a caveat #
Average hourly earnings rose 3.5% year-over-year in June, up to $37.64 (BLS, July 2, 2026). That is a higher nominal wage growth reading than the posted-wage figure tracked by Indeed (2.4% in May), which captures new-hire offer rates rather than existing worker compensation. Both measures are picking up something real; they are measuring different things.
The issue is that June CPI does not land until July 11. The May reading was 4.2% year-over-year — the highest in more than three years, driven in part by energy prices running significantly above year-ago levels. If June CPI holds near that level, real wages remain negative even with the improved nominal figure: 3.5% wages against 4.2% inflation is still approximately -0.7 percentage points in real terms. That is a narrower gap than the -1.8 percentage points calculated from May’s data, but a smaller negative is not a recovery.
If June CPI softens materially — say, to 3.5–3.8% — the real wage picture improves meaningfully and the Q3 compensation case gets stronger. If it accelerates, it gets worse. That read will be available on July 11. Anything said about real wages before then is incomplete.
Three Q3 adjustments #
Rebase your spring benchmarks to the revised numbers. If you were tracking the 114,000 monthly average as a signal that the market was strengthening, that average is smaller now. The post-revision picture of early 2026 shows a market running at rates meaningfully below what was originally reported. That changes the baseline against which Q3 data will be assessed.
The compensation window is still open — but it has a hard deadline. The FOMC meets July 28–29. Until that meeting, the current employment picture (weak payrolls, stable unemployment) gives the Fed limited reason to shift posture dramatically, and wage-compression arguments based on CPI remain valid in negotiation conversations. After the FOMC decision and the arrival of Q3 data, the narrative resets. If you have a compensation case to make, make it in the next three weeks rather than after.
For job seekers in leisure and hospitality: the sector’s weakness is structural, not seasonal. The World Cup month produced -61,000. The sector has shown “little net change” through 2026. The short-cycle event-hiring demand that should have been visible in June was absent. A sector whose hiring doesn’t respond to the World Cup has a mechanism problem, not a timing problem.
The June jobs report answered the question the July 1 article posed. The answer is: the stillness held, the spring was smaller than it appeared, and the 57,000 headline is actually the honest number — the one that the prior months were eventually revised toward. The hires rate confirmation will arrive in late July. It is very unlikely to change what the employment situation data has already told us.
References #
- U.S. Bureau of Labor Statistics. (July 2, 2026). “The Employment Situation — June 2026.” https://www.bls.gov/news.release/empsit.nr0.htm (Accessed July 8, 2026)
- Indeed Hiring Lab, Laura Ullrich. (July 2, 2026). “June 2026 Jobs Report: An Unmoving Tide.” https://www.hiringlab.org/2026/07/02/june-2026-jobs-report-an-unmoving-tide/ (Accessed July 8, 2026)
- Indeed Hiring Lab, Sneha Puri. (June 30, 2026). “May 2026 JOLTS Report: More of the Same.” https://www.hiringlab.org/2026/06/30/may-2026-jolts-report-more-of-the-same/ (Accessed July 8, 2026)
AI Content Notice
This article was created using artificial intelligence technology. Whenever possible, we include references and sources to support the information presented. Readers are encouraged to consult these sources for further information. While we strive for accuracy and provide valuable insights, readers should independently verify information and use their own judgment when making business decisions. The content may not reflect real-time market conditions or personal circumstances.
Related Articles
Infographic: What the June Jobs Report Actually Said About the Hires Rate — and Whether the Stillness Broke
The stillness didn’t break — the ‘strong spring’ was revised down by 74,000 jobs, …
Signals & Shifts: The Stillness Trap
Employment is rising but hiring is not: the labor market is being held up by workers staying put, …
Infographic: Signals & Shifts: The Stillness Trap
Employment is rising but hiring is not: the labor market is being held up by workers staying put, …